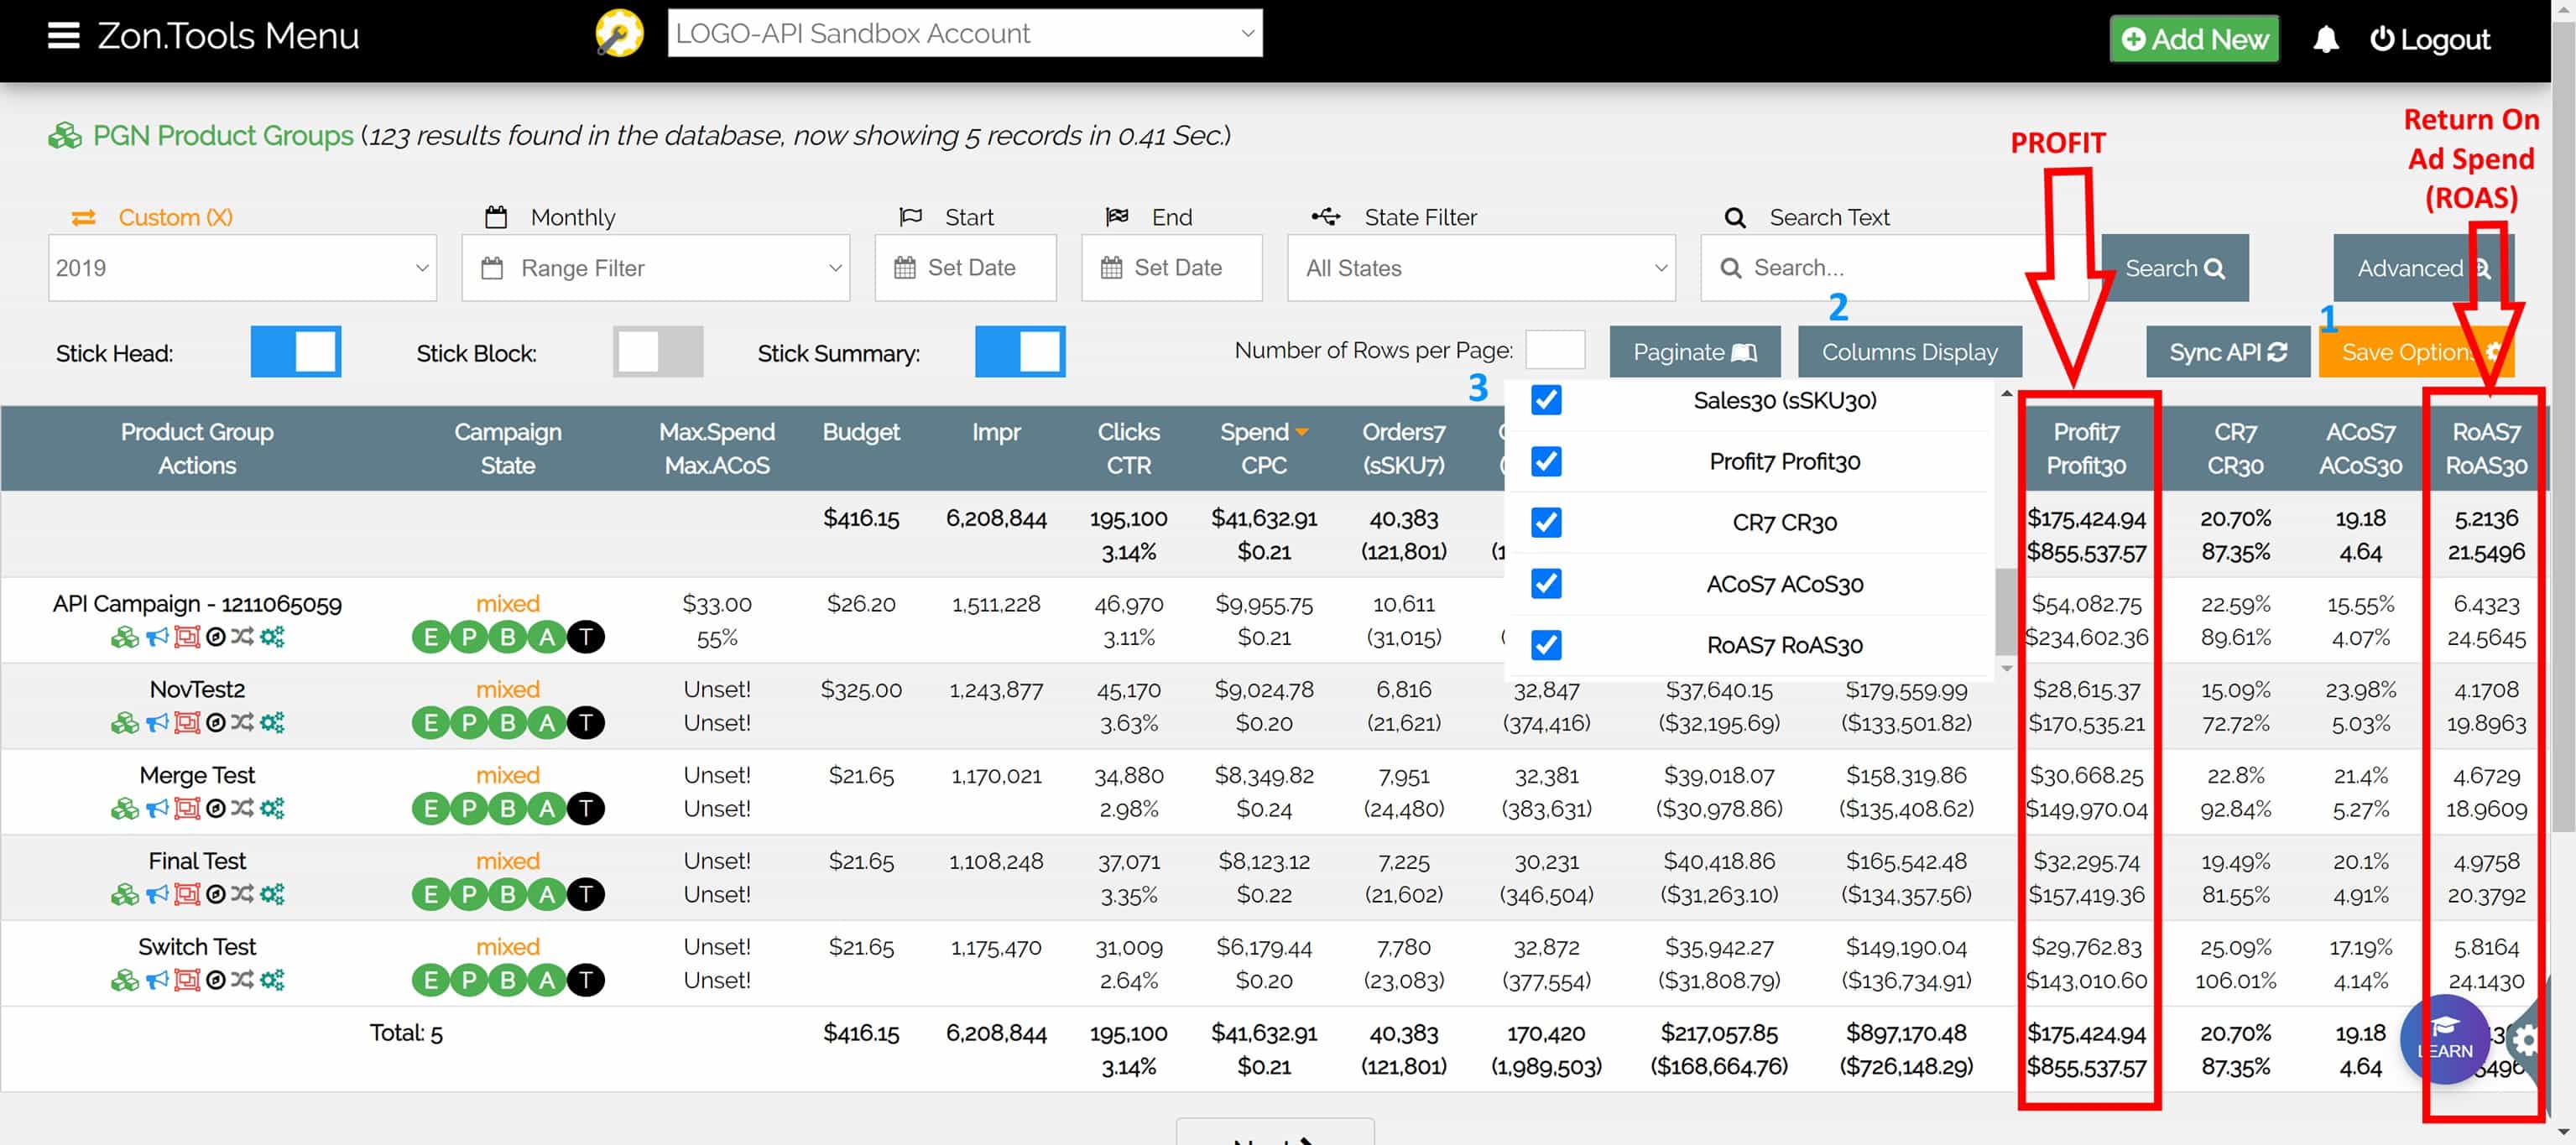
We have 2 new Amazon metrics available on all dashboards:
- Profit (Sales – Spend)
- RoAS (Return on Ad Spend: Sales / Spend)
With 7 and 30 day conversion windows from initial ad click.
Note that you can turn ON and OFF any of these columns from the OPTIONS – COLUMNS DISPLAY buttons as shown in image below…
You can now view ROAS metric on chart.
WHAT IS ROAS?
if you spend $2,000 and earn $10,000 in revenue, your RoAS would be 5. This essentially means that for every $5 you are making in revenue, you are spending $1 on advertising. An interesting thing to note is that unlike many other metrics, a higher RoAS is actually indicative of better performance.
One thing you might notice is that RoAS is the exact inverse of ACoS, meaning that RoAS = 1/ACoS. While RoAs is expressed as an index, ACoS is represented as a percentage. The beauty in this relationship is that if you have your RoAS or ACoS, you can always use that number to calculate the corresponding metric.
For example, if your RoAS is 5, your ACoS is 20% and vice versa. Know your return on spend, and you can calculate your advertising costs. Know your costs, and you can calculate your return. There is a nice back and forth between the two metrics that you can use to assess the overall effectiveness of your campaign.


